Building a Robust Docker Monitoring Stack for Production
As a DevOps engineer managing containerized environments, I’ve learned that proper observability isn’t just nice to have—it’s essential for maintaining system reliability and quickly resolving issues. After experimenting with various tools and configurations in my Docker lab, I’ve developed a comprehensive monitoring stack that I’m now deploying in production environments.
In this post, I’ll walk through my approach to building a complete monitoring solution for Docker environments using industry-standard tools and production-ready best practices.
The Monitoring Stack Architecture
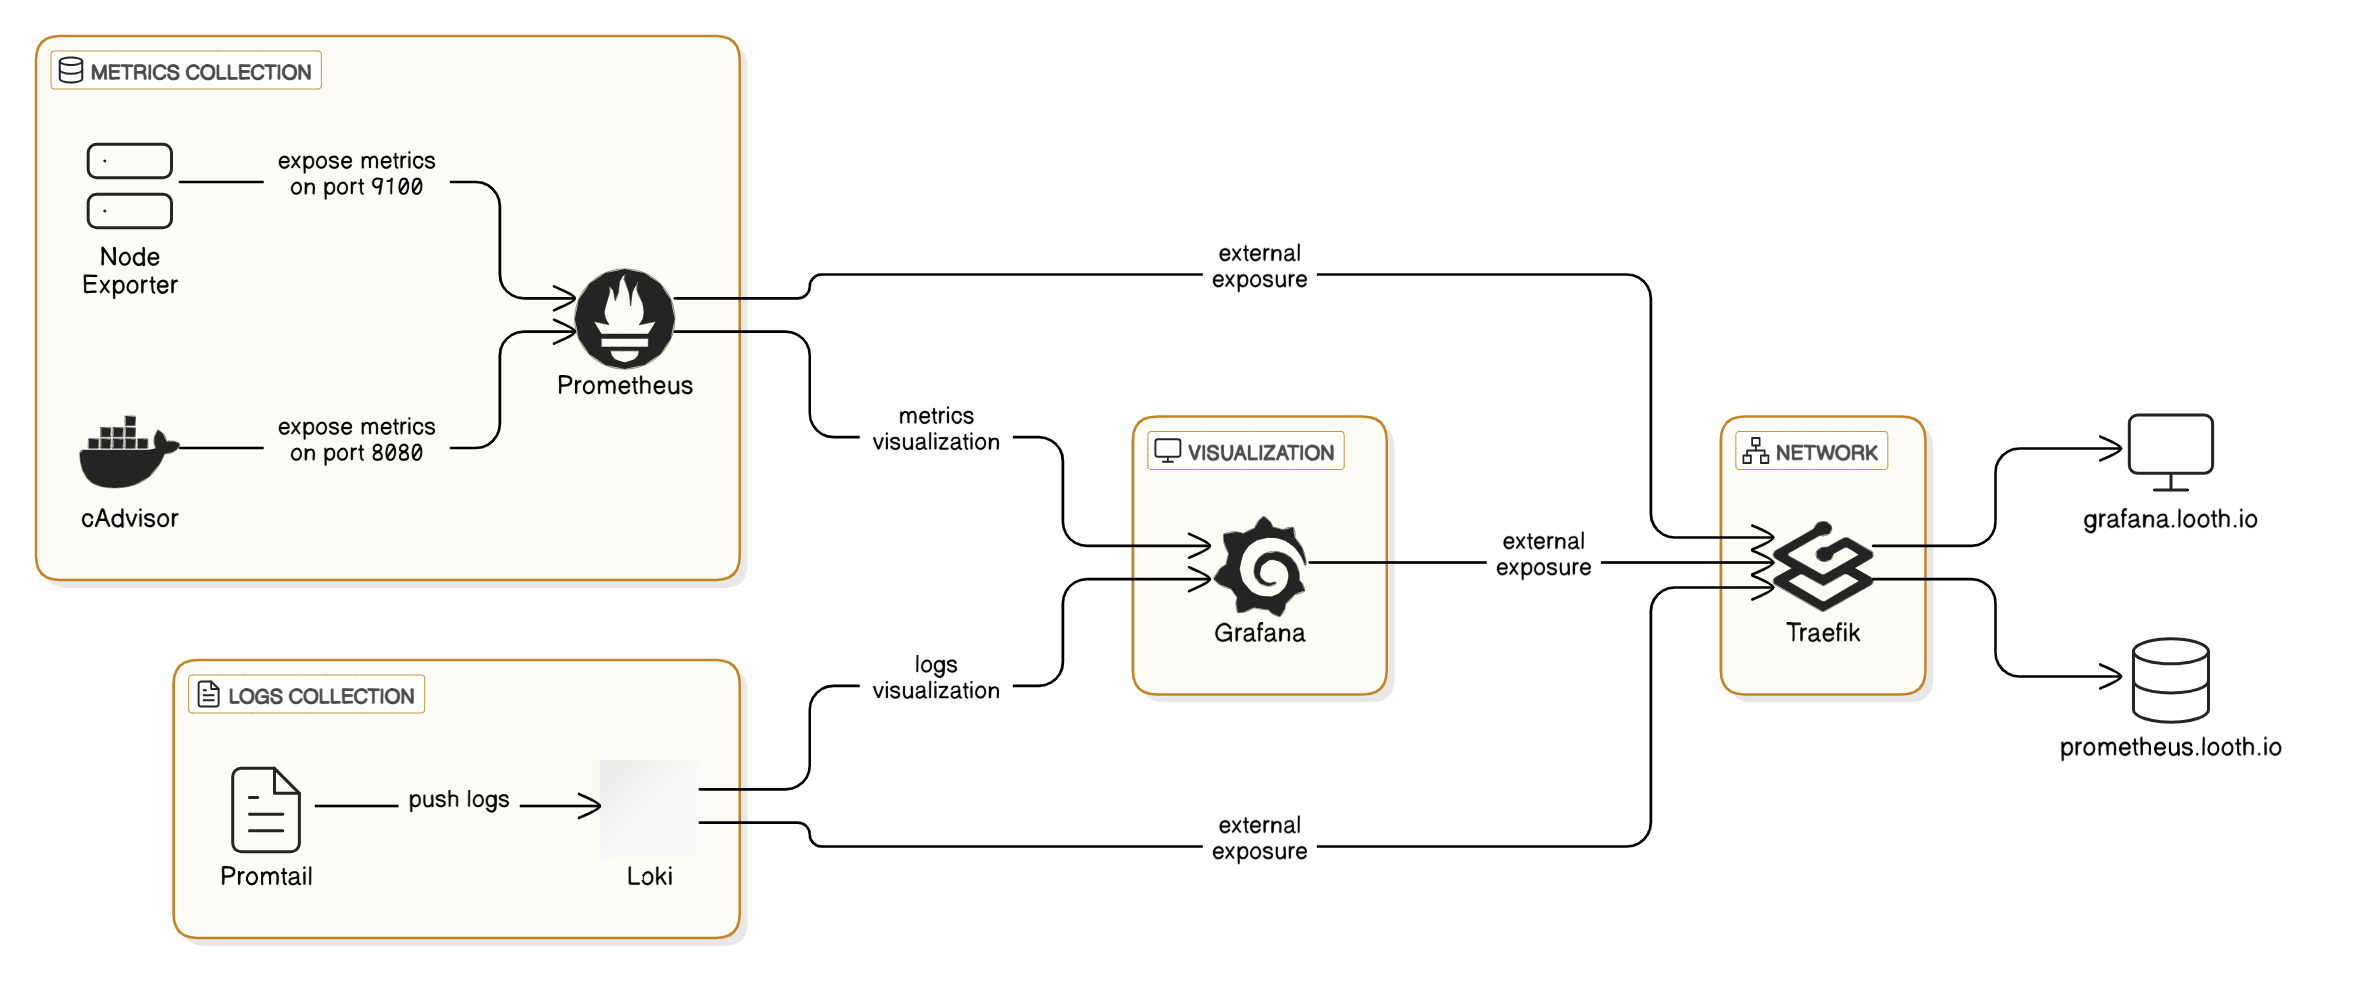
My monitoring solution combines metrics and logs collection into a unified observability platform. Here’s what we’ll be implementing:
-
Metrics Collection & Storage
- Prometheus (time-series database)
- Node Exporter (host-level metrics)
- cAdvisor (container-level metrics)
-
Log Aggregation
- Loki (log storage and querying)
- Promtail (log collector)
-
Visualization
- Grafana (unified dashboard)
-
Security & Access
- Traefik (reverse proxy with TLS)
- Basic authentication
Prerequisites
Before getting started, you’ll need:
- Docker and Docker Compose installed
- A server running Linux (I’m using Linode)
- A domain with DNS configured
- Traefik already set up as a reverse proxy with SSL support
Implementation Details
Docker Compose Configuration
Let’s start with our complete docker-compose.yml configuration. This is the backbone of our monitoring stack:
|
|
Essential Configuration Files
Let’s look at the configuration for each component of our monitoring stack.
Prometheus Configuration
Create a prometheus.yml file in the ./prometheus directory:
|
|
Loki Configuration
Create a loki-config.yaml file in the ./loki directory:
|
|
Promtail Configuration
Create a promtail-config.yaml file in the ./promtail directory:
|
|
Production-Ready Best Practices
Throughout my testing and implementation, I’ve incorporated several production-ready practices that make this monitoring stack reliable and secure:
1. Resource Management
One of the most critical aspects of running a monitoring stack in production is proper resource management. I’ve learned from experience that without explicit limits, monitoring tools can sometimes consume excessive resources and impact the performance of your production services:
|
|
These limits prevent any single component from consuming too many resources and potentially bringing down the entire host. The values are based on my observations of typical resource usage in production environments.
2. Network Segmentation
The stack uses two separate networks:
traefik-public: An external network used for components that need to be publicly accessible through Traefikmonitoring: An internal bridge network for components to communicate securely
This approach follows the principle of least privilege by only exposing the necessary services, keeping the attack surface as small as possible.
3. Data Persistence
Both Prometheus and Grafana use named volumes to ensure data persistence across container restarts or upgrades:
|
|
For Loki, I’ve chosen a bind mount approach to make the data easier to back up and manage:
|
|
This strategy ensures you won’t lose historical metrics or dashboard configurations during maintenance or updates.
4. Security Measures
Several security practices are implemented in this stack:
- TLS Encryption: All public endpoints use HTTPS via Traefik’s Let’s Encrypt integration
- Basic Authentication: Sensitive dashboards (Prometheus, Loki) use basic auth to prevent unauthorized access
- Read-Only Mounts: All volume mounts use read-only access where possible
- Limited User Sign-up: Grafana is configured to prevent unauthorized user registration
These measures ensure that your monitoring data remains secure and accessible only to authorized personnel.
5. Container Best Practices
Other Docker-specific best practices used throughout this stack:
- Named Containers: Makes it easier to reference them in logs and commands
- Fixed Versions: Using specific image versions instead of
latestfor reproducibility - Health Checks: Services implement health checks for better orchestration
- Restart Policies: All services are configured to restart automatically if they crash
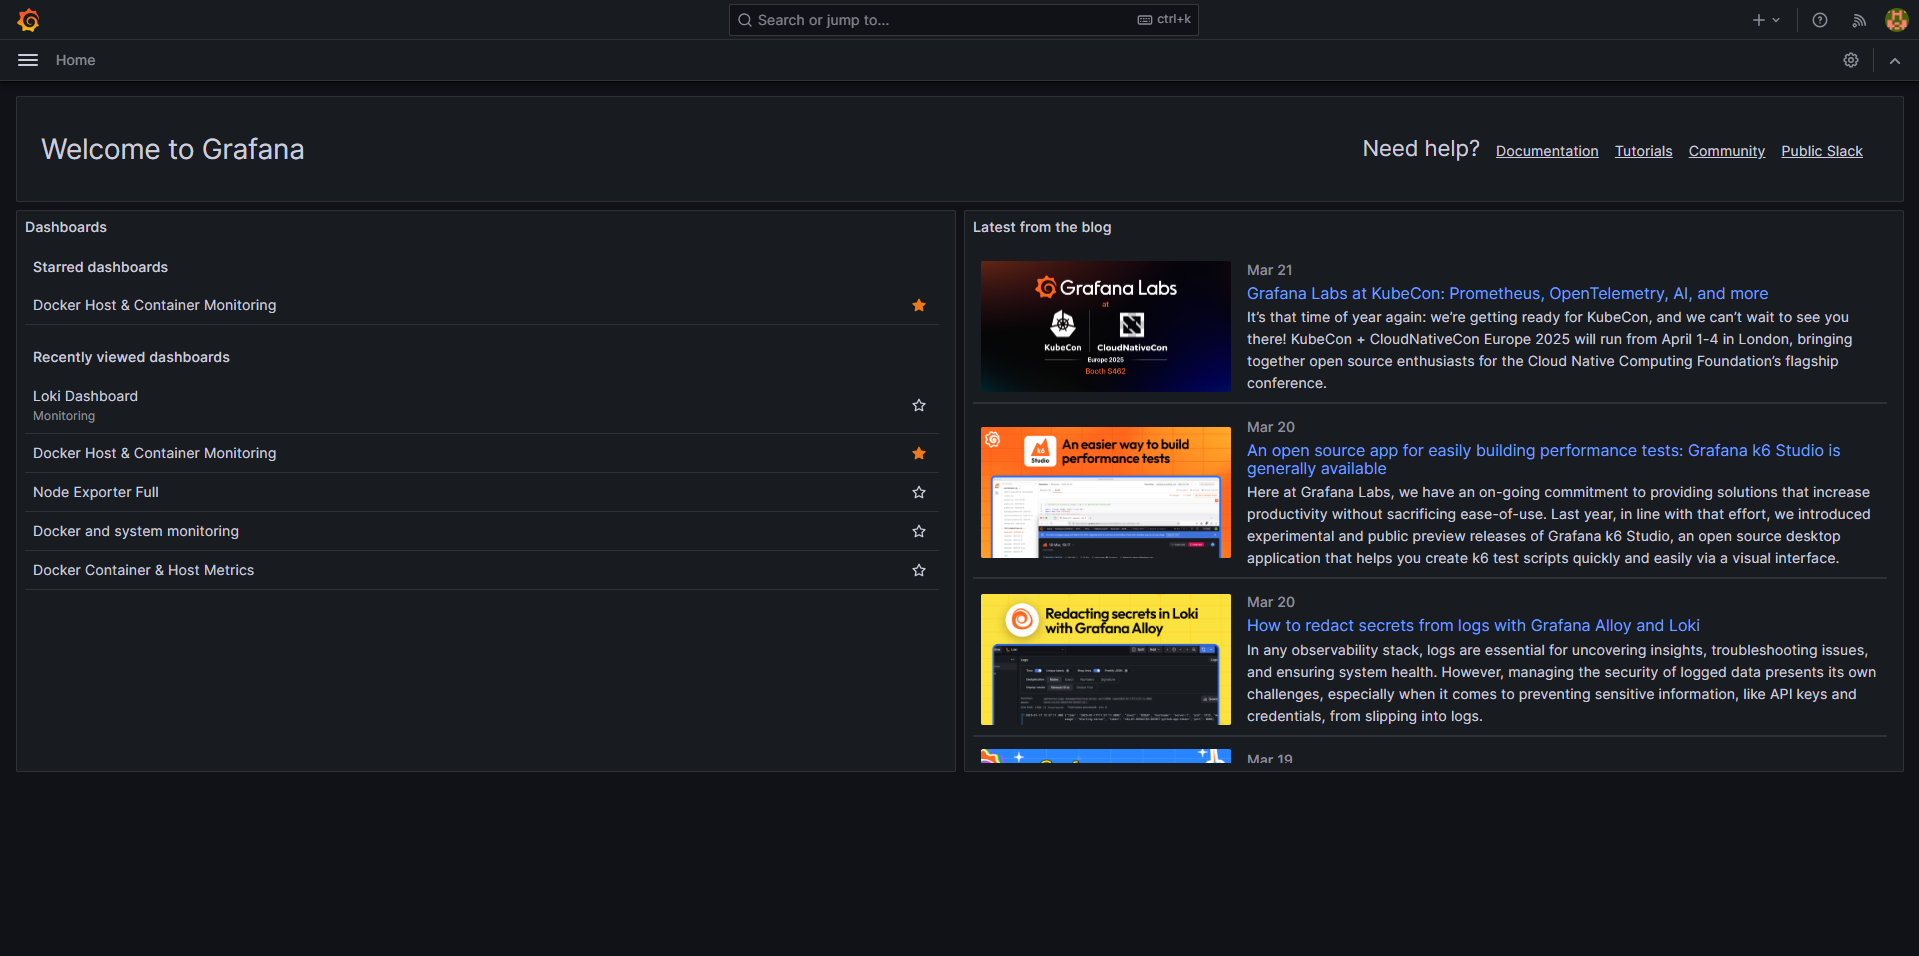
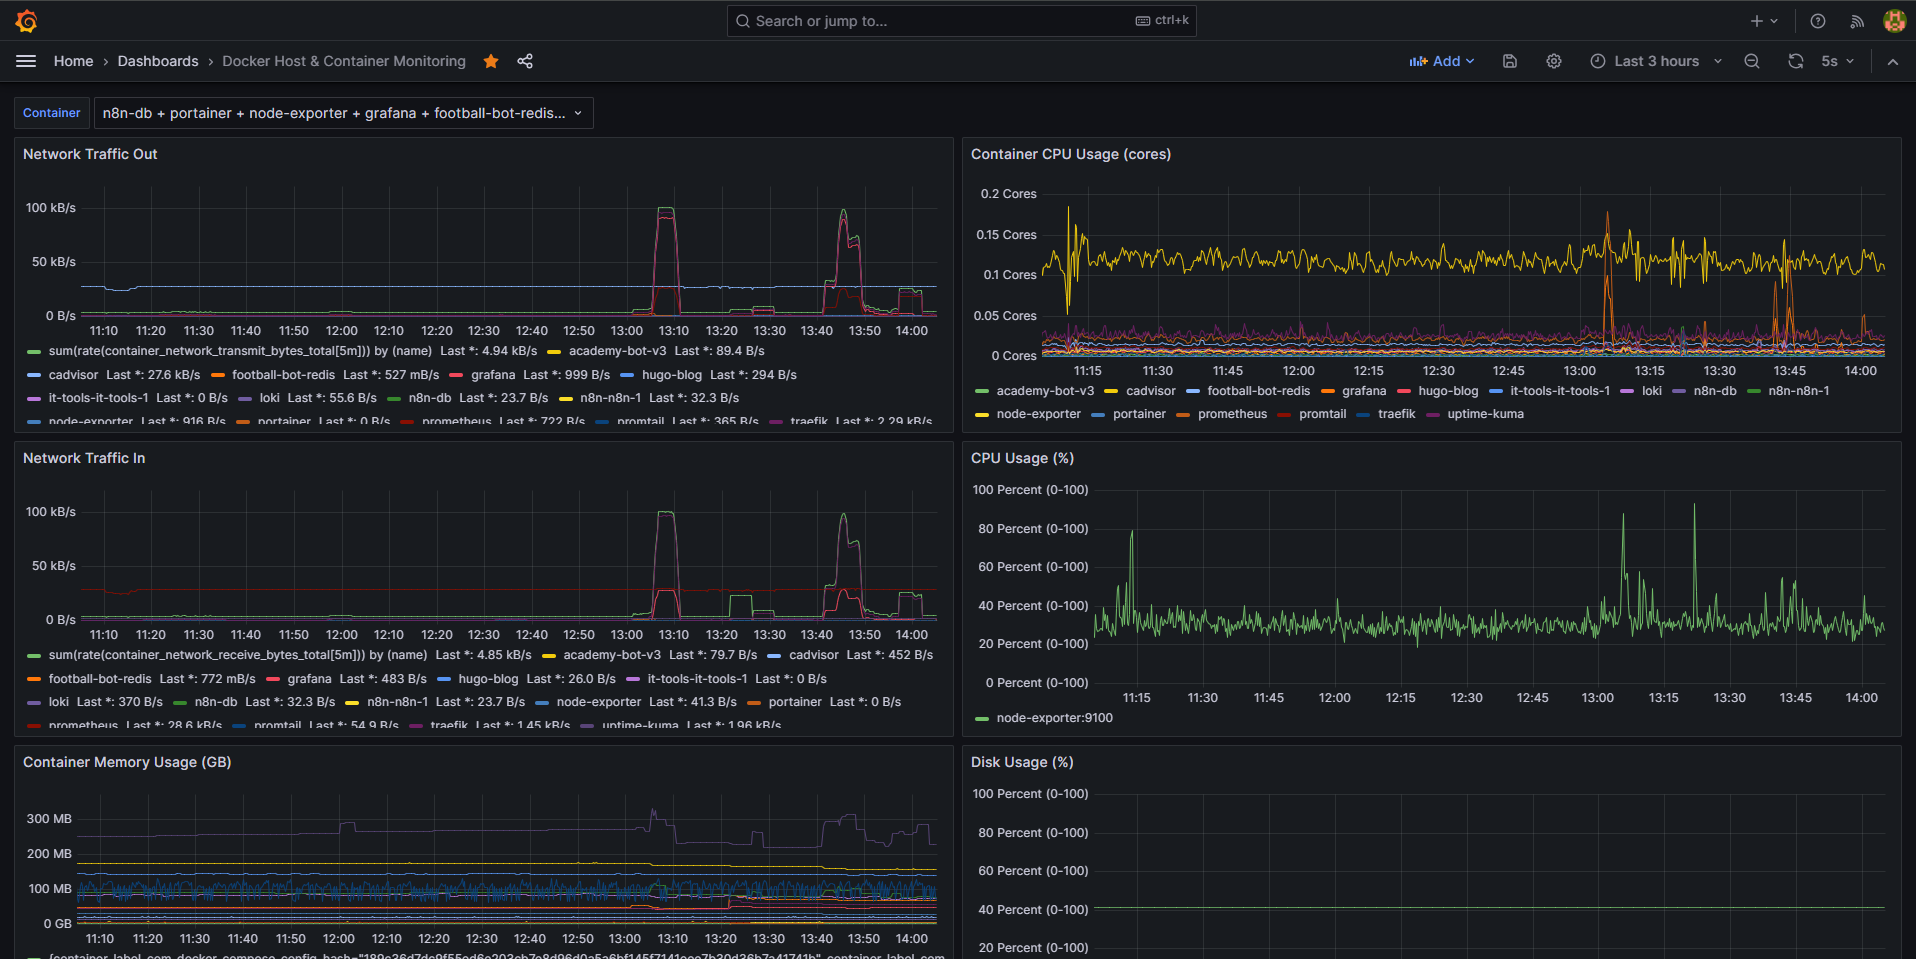
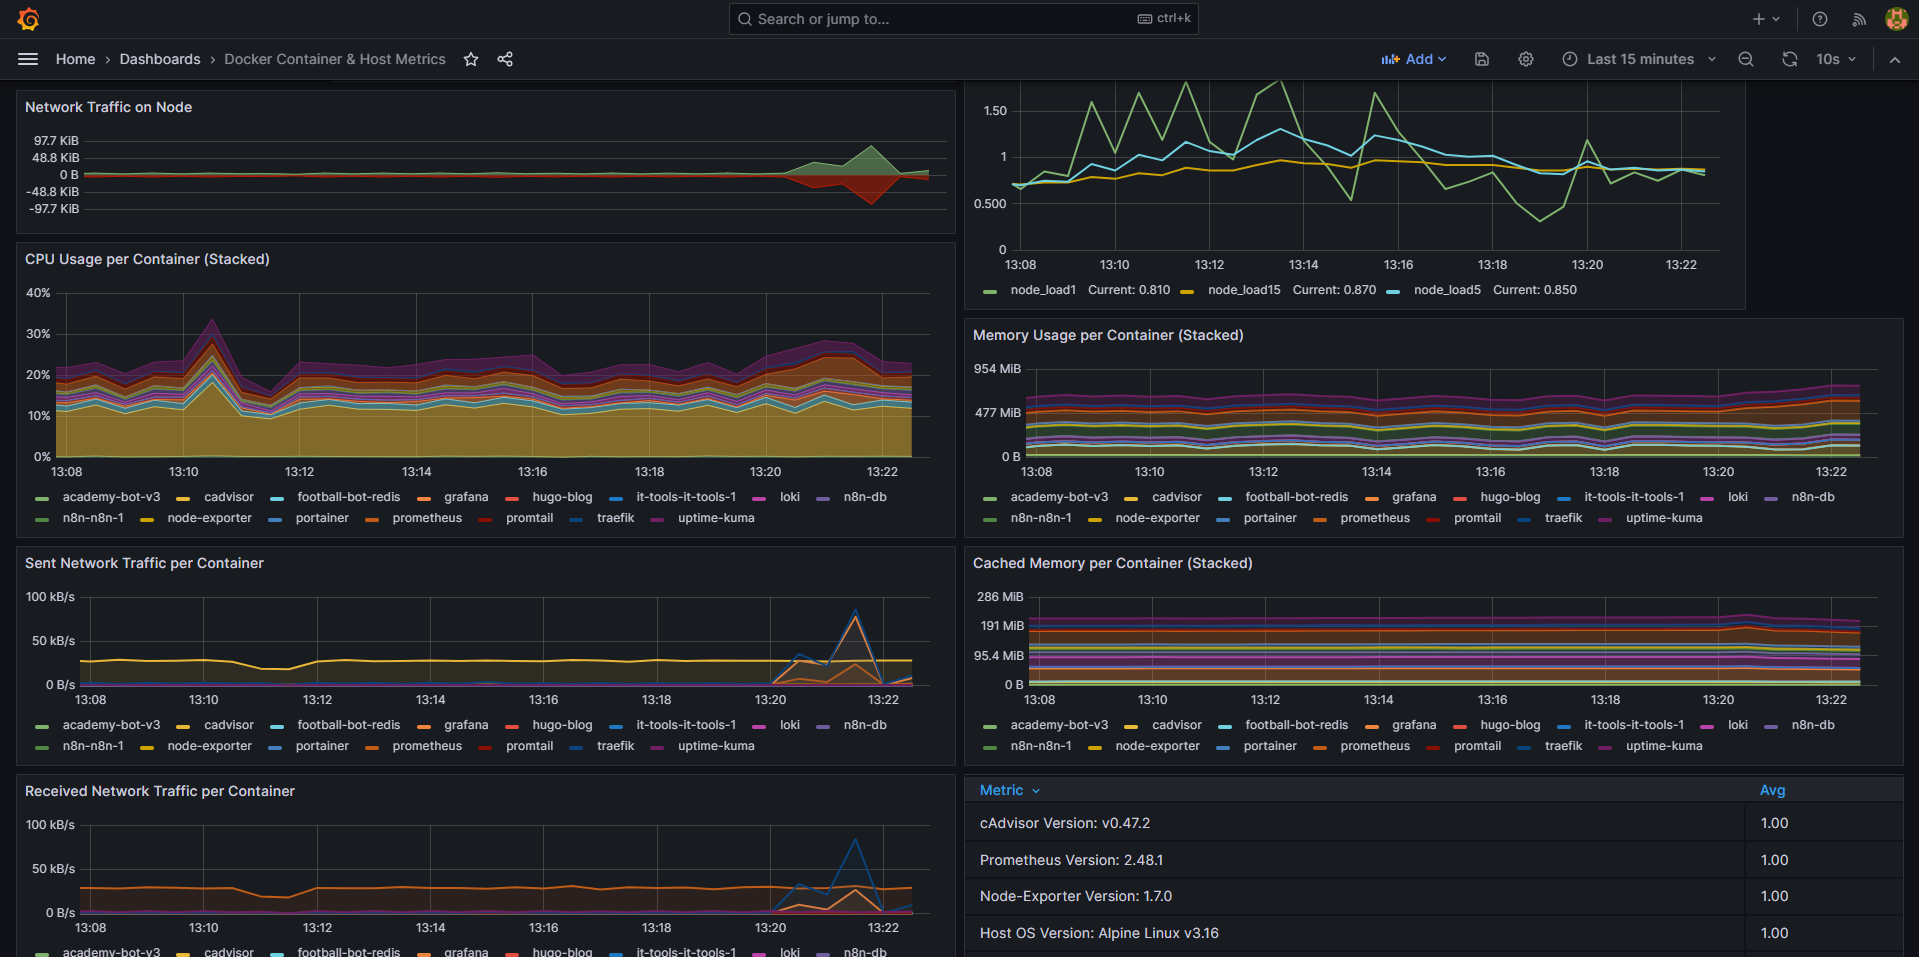
Setting Up Grafana Dashboards
Once your stack is running, you’ll need to set up dashboards in Grafana for visualization.
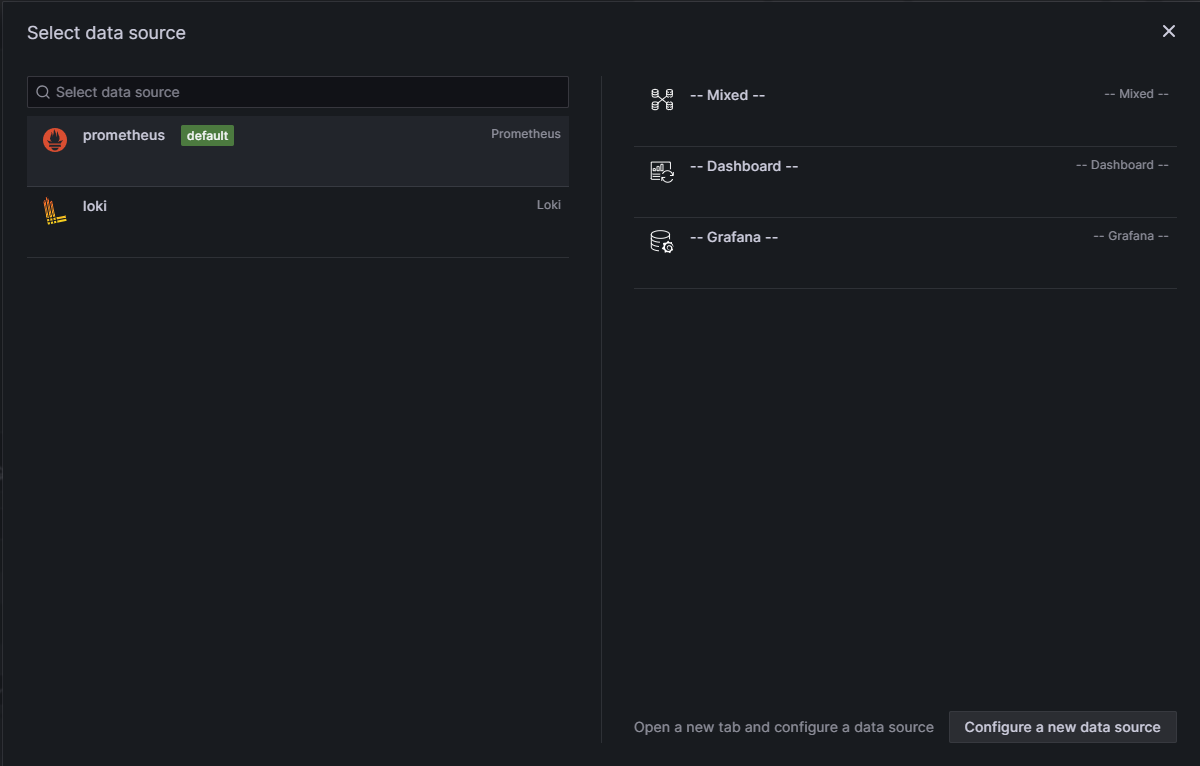
1. Add Data Sources
First, add both Prometheus and Loki as data sources in Grafana:
-
Prometheus:
- URL:
http://prometheus:9090 - Access: Server (default)
- URL:
-
Loki:
- URL:
http://loki:3100 - Access: Server (default)
- URL:
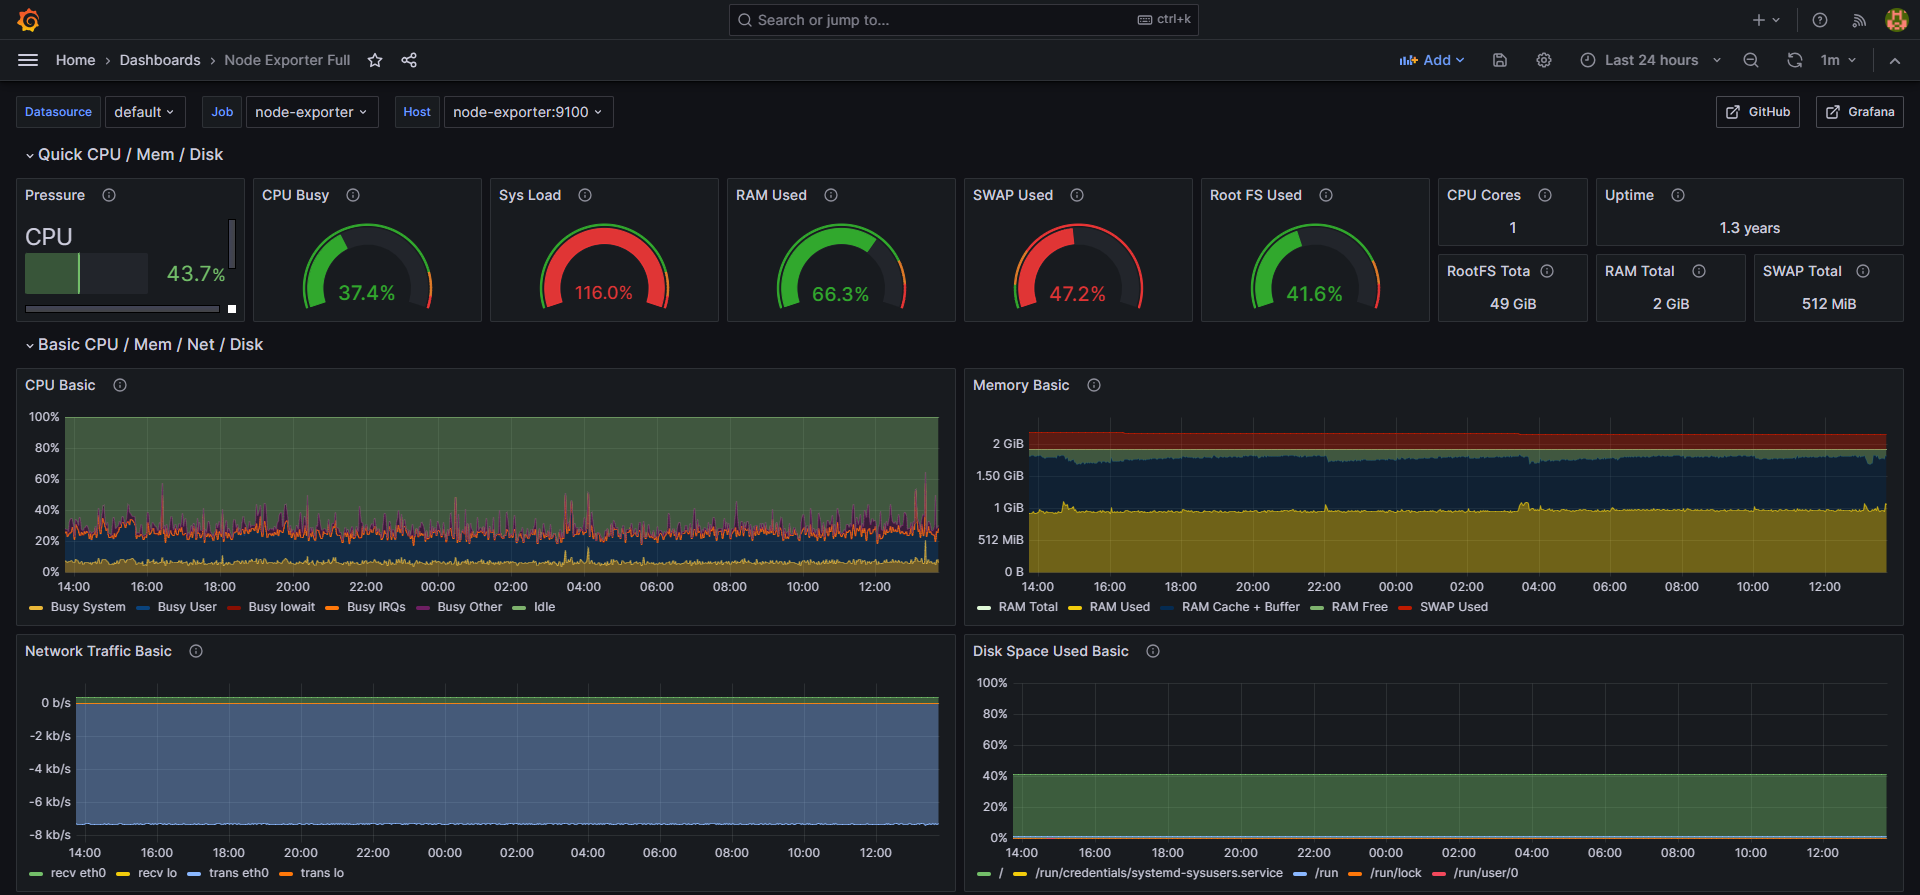
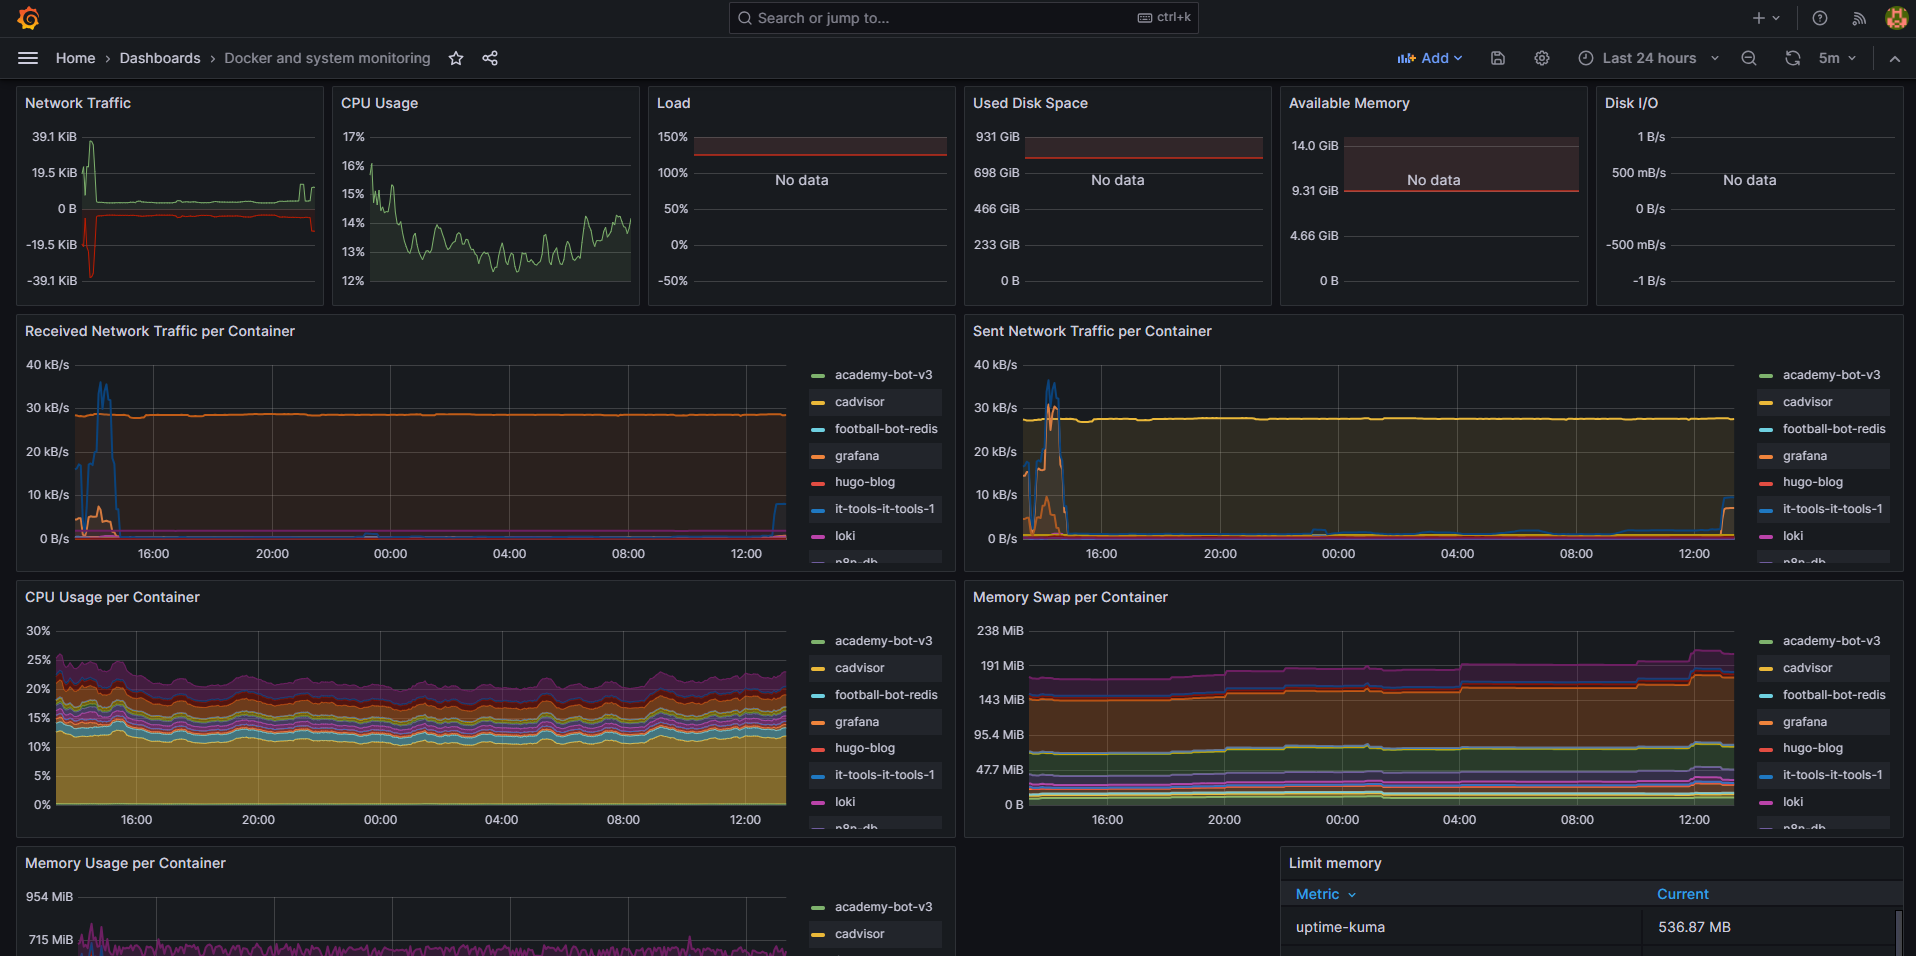
2. Import Dashboard Templates
Grafana has many pre-built dashboards you can import. Here are some recommended dashboard IDs that I’ve found particularly useful in production:
- Node Exporter Full: 1860
- Docker Containers: 893
- Traefik: 11462
3. Create a Custom Logs Dashboard
For container logs, create a custom dashboard with these panels:
-
All Container Logs
- Query:
{container=~".+"}
- Query:
-
Error Logs Across All Containers
- Query:
{container=~".+"} |= "error" or {container=~".+"} |= "ERROR"
- Query:
-
Logs by Container (using a variable)
- Dashboard variable query:
label_values(container) - Panel query:
{container="$container"}
- Dashboard variable query:
-
Log Volume Over Time
- For monitoring spikes in logging activity
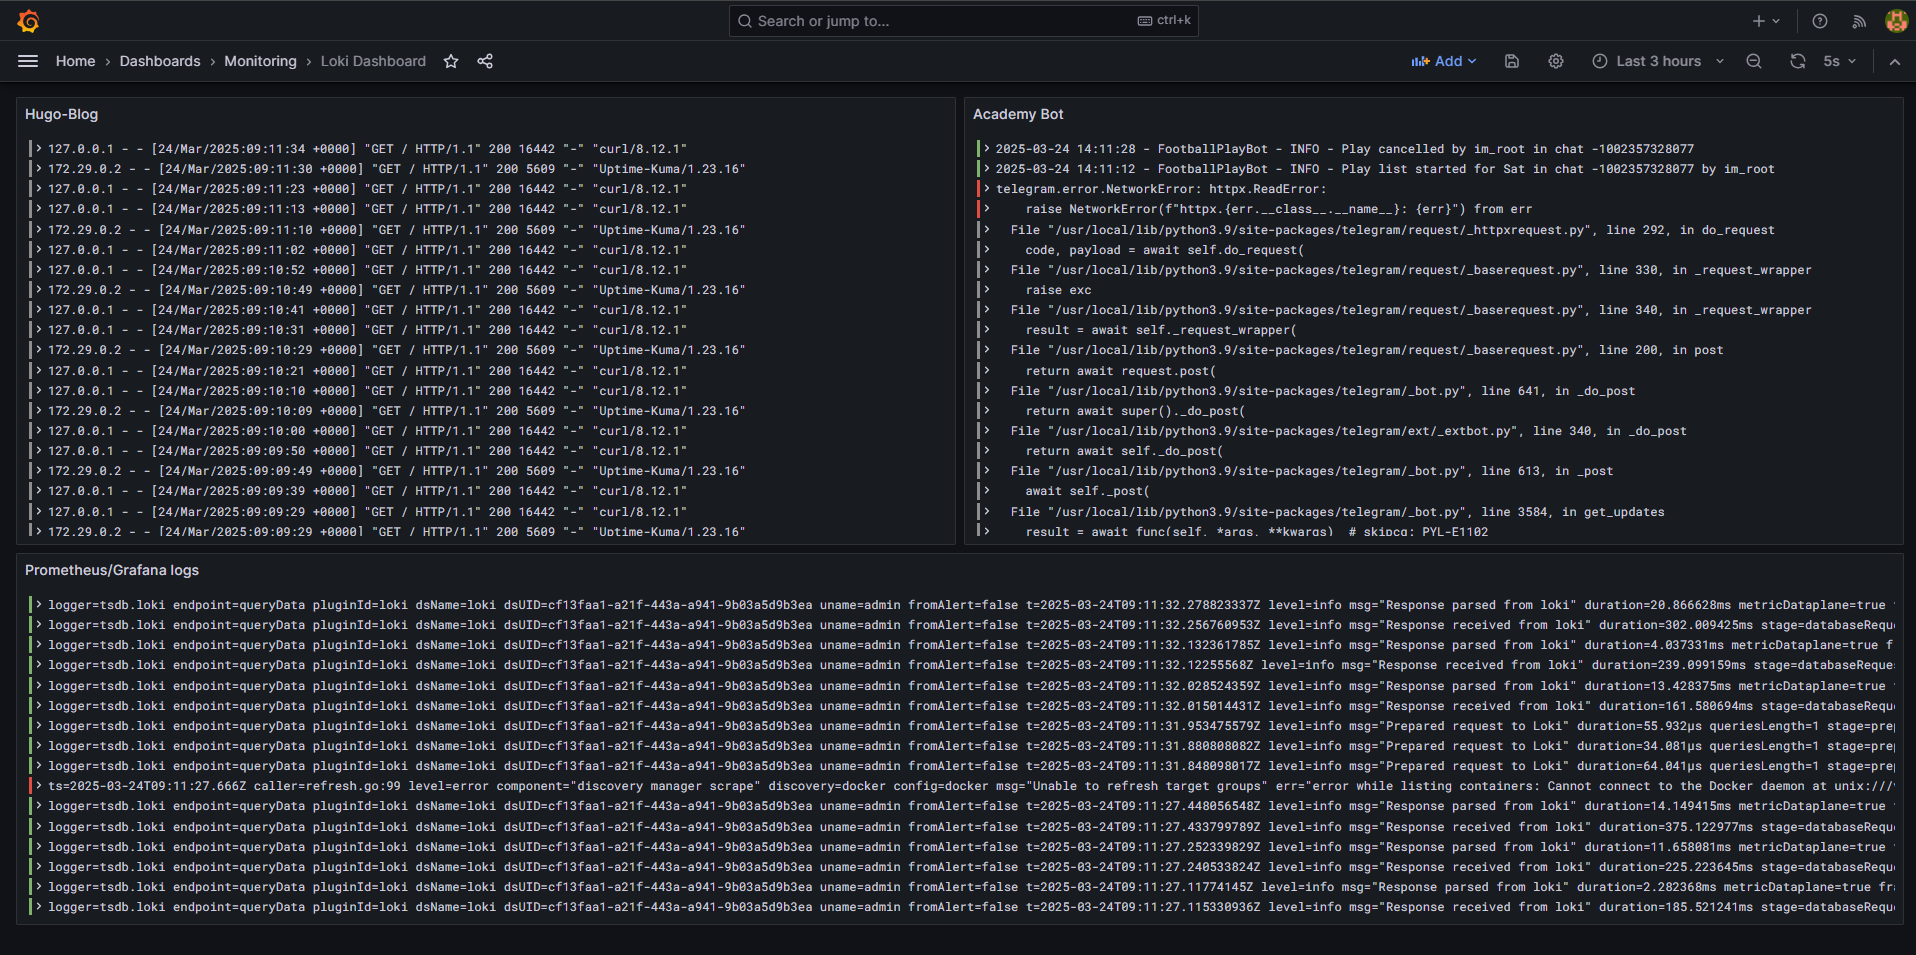
Here are some useful LogQL queries I frequently use in production:
# All logs for a specific container
{container="traefik"}

# Filter by HTTP status codes (for web services)
{container="traefik"} |~ "HTTP/1.1\\" (4|5)\\d\\d"

# Find error messages
{container=~".+"} |= "error" or {container=~".+"} |= "ERROR"

# Find warnings
{container=~".+"} |= "WARN" or {container=~".+"} |= "WARNING"
Alerting and Notification
While not covered in this basic setup, you can extend this monitoring stack with alerting capabilities:
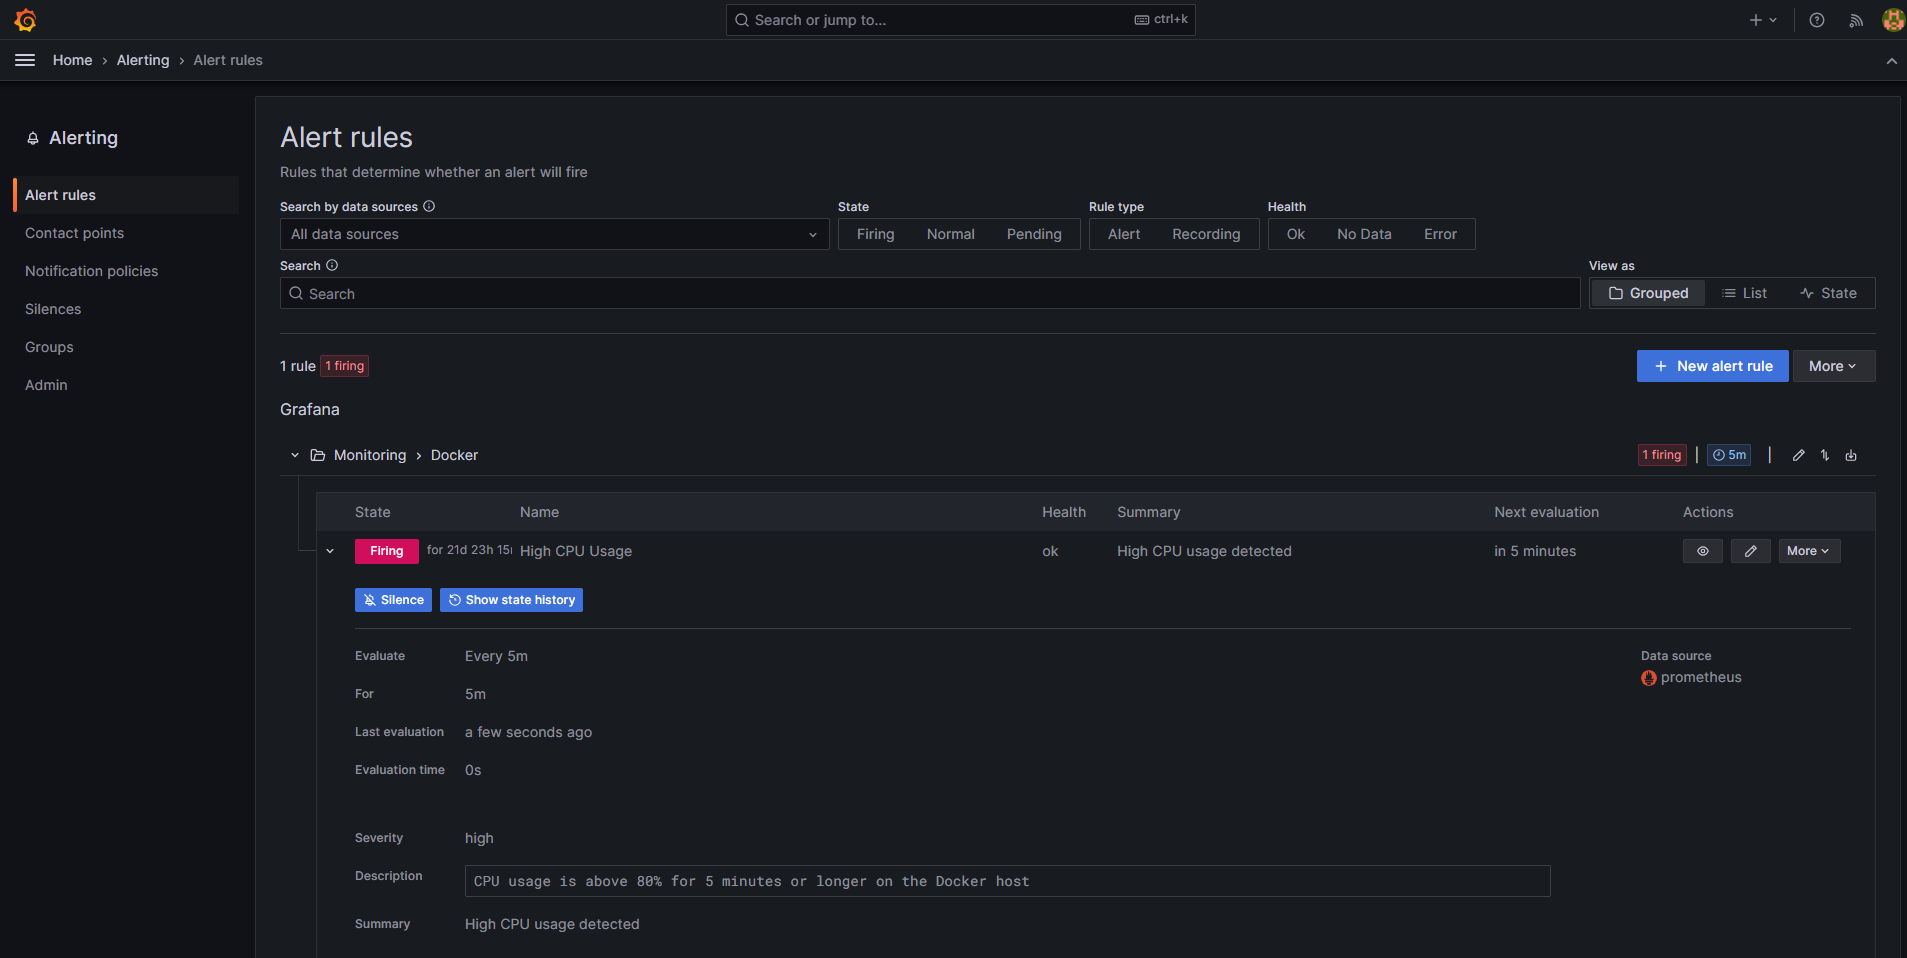
- Use Prometheus AlertManager for metrics-based alerts
- Configure Grafana alerting for both logs and metrics
- Set up notification channels (email, Slack, PagerDuty, etc.)
I’ll cover my alerting setup in a future post, as it deserves its own dedicated walkthrough.
Conclusion
After several iterations in my lab environment, this monitoring stack has proven itself ready for production use. It provides complete visibility into containerized applications through both metrics and logs, all while following DevOps best practices for security, resource management, and data persistence.
The beauty of this approach is its modularity—you can easily extend it with additional exporters, dashboards, or integrations as your monitoring needs evolve.
By combining Prometheus, Loki, and Grafana, you get a powerful monitoring solution that helps ensure the reliability and performance of your applications while making troubleshooting much more straightforward.
Next Steps
Based on my testing and production deployment, here are some future improvements I’m planning to implement:
- Setting up AlertManager for automated alerts based on resource thresholds
- Adding specialized exporters for MySQL, PostgreSQL, and Redis
- Implementing distributed tracing with Tempo to complement metrics and logs
- Exploring long-term storage solutions for metrics and logs retention
Feel free to adapt this setup to your specific needs or reach out if you have any questions about implementing this in your own Docker environment!